

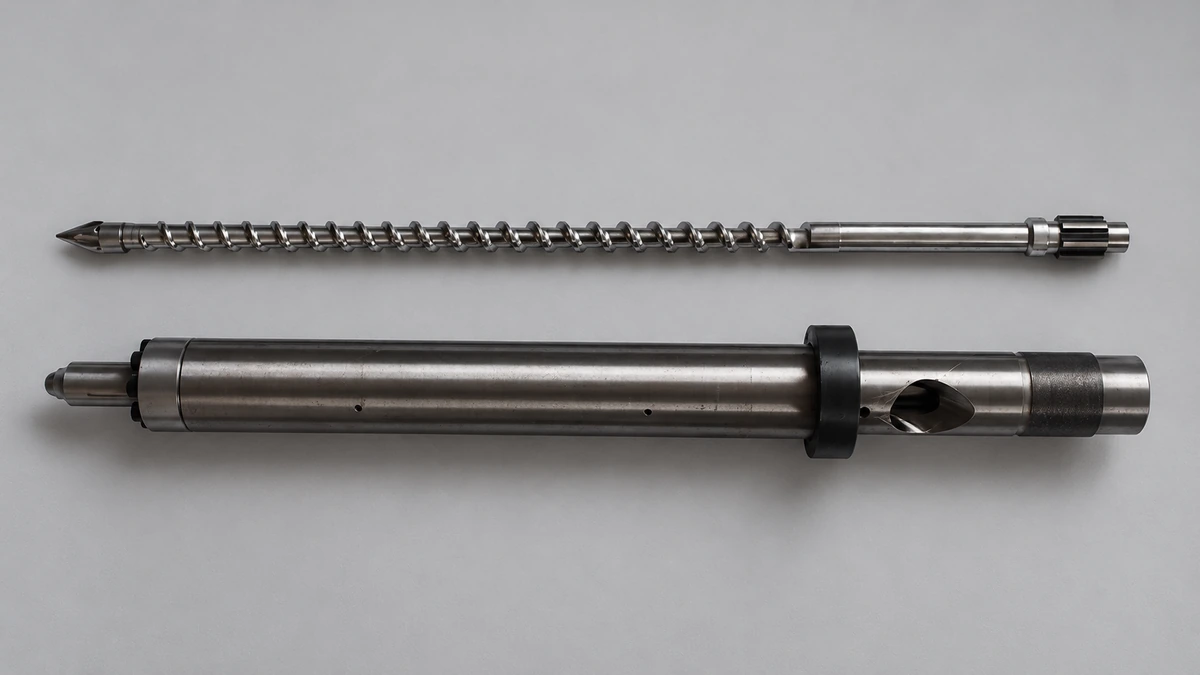
What Is Back Pressure in Injection Molding
Imagine this: your injection molding machine is between shots, the screw is spinning, melting fresh resin, and quietly building up the next shot. Everything looks routine. But behind the scenes, a single parameter is shaping the quality of every pellet that melts — and most operators never give it a second thought. That parameter is back pressure.
Back pressure in injection molding is the resistance applied against the injection screw as it retracts during the plasticating (recovery) phase. It is typically expressed in psi or bar and is controlled via a hydraulic relief valve on hydraulic machines or a servo motor braking action on electric machines.
Sounds simple enough, right? Yet this one setting influences melt consistency, color dispersion, trapped air, and shot-to-shot repeatability. When it is wrong, you pay for it in scrap, cycle time, and customer complaints. Understanding what it actually does — and how it differs from the other pressures in your process — is the first step toward getting it right.
What Back Pressure Actually Means in the Plasticating Phase
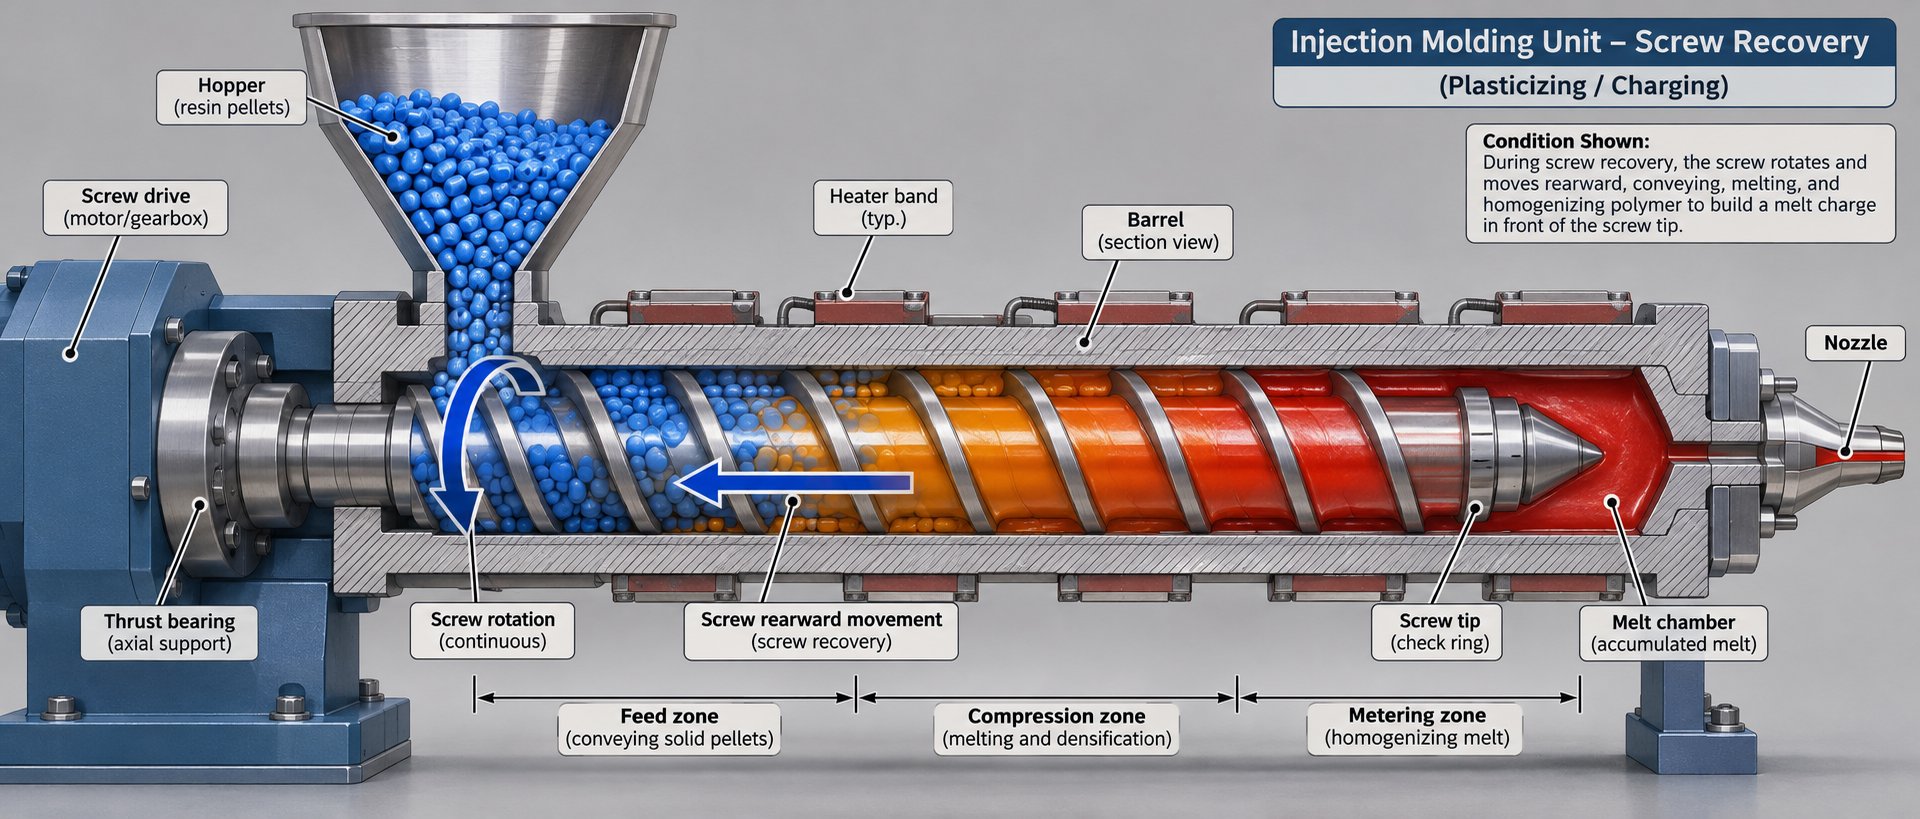
During screw recovery, the screw performs two jobs at once. It rotates to convey pellets forward from the hopper, compressing and melting them through a combination of barrel heat and mechanical shear. As molten plastic accumulates ahead of the screw tip, that growing pool of melt pushes the screw rearward — much like a syringe plunger being forced back by incoming fluid.
Back pressure is the deliberate resistance opposing that rearward movement. On a hydraulic machine, restricting oil flow out of the injection cylinder creates the resistance. On a servo-electric press, the motor applies a braking torque against the screw's retreat. Either way, the result is the same: the melt must work harder to push the screw back, which compresses the plastic in front of the non-return valve and makes the density of each shot more consistent. This slight resistance also forces the screw to rotate a more consistent number of turns during recovery, improving color mixing and melt uniformity.
Without adequate resistance, the screw slides back too easily. Air pockets survive, pigment clumps persist, and melt density varies from shot to shot. Too much resistance, and you'll generate excessive heat, extend cycle times, and risk degrading thermally sensitive resins. The sweet spot sits between those extremes — and finding it requires understanding how this pressure interacts with the rest of your process.
How Back Pressure Differs from Injection and Hold Pressure
One of the most common sources of confusion for newer molders is lumping all three major pressures together. Each one operates during a different phase of the cycle, targets a different goal, and lives in a different pressure range. Here is a quick comparison:
| Pressure Type | Phase of Cycle | Typical Range | Primary Function |
|---|---|---|---|
| Back Pressure | Plasticating (screw recovery) | 500 - 1,000 psi specific | Ensures consistent melt density, homogeneity, and air removal |
| Injection Pressure | Fill stage | 5,000 - 20,000+ psi specific | Pushes molten plastic through the runner system and into the cavity |
| Hold Pressure | Pack and hold stage | Typically ~50 - 85% of peak injection pressure | Compensates for volumetric shrinkage as the part cools in the mold |
Notice the scale difference. Back pressure during the injection molding process is an order of magnitude lower than fill pressure, yet its influence on part quality is disproportionately large. A small change here ripples through every downstream stage — altering the melt density that injection pressure must push and that hold pressure must pack. That cascading effect is exactly why treating it as an afterthought, or adjusting it as a quick fix for unrelated defects, so often creates more problems than it solves.
The real question, then, is not just what this setting does — but how it does it at the screw-and-melt level, where shear, heat, and polymer behavior collide.
How Back Pressure Works During Screw Recovery
Every shot your injection molding machine produces begins not at the moment of injection, but during the quieter recovery phase that precedes it. This is where the screw prepares the melt — and where back pressure exerts its greatest influence on what ultimately fills your cavities.
The Screw Recovery Cycle Step by Step
Picture the screw beginning to rotate inside the barrel. Here is the sequence of events that unfold during every recovery stroke:
- Screw rotation and pellet conveyance. The screw's helical flights grab solid pellets from the hopper and drag them forward along the barrel. At this point, the material is still cold, solid, and full of trapped air between granules.
- Compression and melting. As pellets advance into the compression (transition) zone, the screw channel depth decreases. This squeezes the material against the barrel wall, generating friction-based shear heat. Radiant heat from the heater bands adds thermal energy from the outside. Together, these two sources break down the solid pellet structure and create a growing melt pool.
- Volatile expulsion. The compressive action in this zone does more than melt plastic — it pushes trapped air and volatiles rearward, out of the melt. Insufficient compression at this stage leaves gas pockets in the shot, often appearing later as splay or bubbles in the finished part.
- Melt accumulation ahead of the screw tip. Fully molten resin passes through the non-return valve (check ring) and collects in front of the screw. This growing reservoir of melt pushes the screw rearward.
- Screw retraction against applied back pressure. Here is where your injection molding machine back pressure setting takes effect. The resistance you have dialed in opposes the screw's retreat, forcing the melt to stay in the screw channels longer before passing forward. More resistance means more rotational work on the polymer, more mixing, and a denser, more uniform melt pool.
You'll notice a direct trade-off in this sequence. Higher resistance improves homogeneity — better color dispersion, fewer unmelts, tighter shot-to-shot weight consistency. But that same resistance also slows recovery, extends the time the melt sits at elevated temperature, and adds mechanical energy that converts directly into heat. That last point deserves its own discussion, because it catches many processors off guard.
Shear Heating and Its Relationship to Back Pressure
When you increase back pressure, you are not simply "squeezing" the melt harder. You are forcing the screw to do more mechanical work on the polymer with every rotation. That extra work does not vanish — it converts into thermal energy through a process called shear heating. The result? The actual temperature of the plastic inside the barrel rises beyond what the heater bands alone would produce.
How significant is this gap? Two machines running identical barrel temperature setpoints can produce melts that differ by 20 to 40 degrees Fahrenheit if their back pressure settings diverge. The barrel zone display reads a steady 420 degrees, yet the polymer flowing through the screw channels may be sitting at 450 or higher. For general-purpose resins like polypropylene, that margin is usually manageable. For thermally sensitive polymers, it can be catastrophic.
Consider what happens at the molecular level when shear heating pushes a degradation-prone resin past its safe processing window:
- Chain scission. Long polymer chains snap under excessive thermal and mechanical energy, reducing molecular weight and weakening the final part's mechanical properties.
- Off-gassing. Decomposition byproducts form within the melt. POM (acetal) generates formaldehyde gas. PVC releases hydrochloric acid. Certain nylons produce steam from residual moisture accelerated by elevated temperatures.
- Discoloration. Yellowing, brown streaks, or black specks appear as the base resin or pigment system thermally degrades — defects that no amount of downstream packing or cooling can reverse.
This is precisely why processors who rely solely on barrel zone readings to judge melt condition are, in effect, tuning blind.
Barrel temperature readings alone do not reflect true melt temperature when back pressure is elevated. The actual polymer temperature is driven primarily by shear energy, screw design, and residence time — not by heater band setpoints.
Understanding how to set back pressure in injection molding means accepting that this parameter does not operate in a vacuum. It interacts dynamically with shear rate, residence time, and — critically — the physical geometry of the screw itself. A screw with aggressive compression channels amplifies shear heating at any given back pressure level, while a worn screw with reduced flight depth may deliver far less effective resistance than the controller display suggests. That interplay between hardware and process setting is where many hidden quality problems originate.
How Screw Design Influences Optimal Back Pressure
Here is a scenario that plays out in molding shops more often than most people realize: an operator dials in the same injection molding back pressure setting that worked perfectly last month, yet parts suddenly show color streaks, unmelts, or inconsistent shot weights. Nothing else changed — same resin, same mold, same barrel temperatures. What happened?
In many cases, the answer lives inside the barrel. The screw itself — its geometry, its wear condition, and how well it matches the resin being processed — determines how much work back pressure actually performs on the melt. Two screws running at identical pressure settings can deliver wildly different melt quality depending on their design. Understanding this relationship is what separates processors who chase defects from processors who prevent them.
Compression Ratio and L/D Ratio Effects on Melt Quality
Every injection screw has a compression ratio — the ratio of the feed zone channel depth to the metering zone channel depth. A screw with a 2.5:1 compression ratio, for example, reduces the available channel volume by 60% as material moves from the feed section to the metering section. That mechanical squeeze is the screw's built-in melting and mixing engine.
Why does this matter for your back pressure definition in injection molding? Because the screw's compression ratio and your back pressure setting are essentially doing overlapping jobs. Both add shear work to the melt. Both improve homogeneity. And both generate heat. The critical difference is that compression ratio is fixed in the hardware, while back pressure is adjustable at the controller.
This creates a practical guideline that many operators overlook:
- General-purpose screws with moderate compression ratios (around 2.0:1 to 2.5:1) often need higher back pressure to compensate for their less aggressive melting action. Without that extra resistance, the melt may pass forward with unmelted pellet cores, poor color dispersion, or inconsistent density.
- High-compression screws (3.0:1 or above) or screws equipped with dedicated mixing sections — such as Maddock-style barriers or dispersive mixing elements — deliver equivalent or better melt homogeneity at significantly lower back pressure. Pushing the setting higher on these screws risks over-shearing the resin, driving melt temperature well past the barrel setpoint.
- Specialty screws for sensitive resins — imagine a low-compression PVC screw or a gentle-shear design for POM — are engineered specifically so the hardware does the right amount of work without relying on elevated back pressure. Setting aggressive resistance on these screws defeats their purpose and can trigger degradation, off-gassing, or acid formation that corrodes the barrel itself.
The length-to-diameter (L/D) ratio adds another layer. Most injection molding screws use a 20:1 L/D ratio, but variations exist across machine platforms. A longer L/D ratio gives the resin more residence time in the barrel and more opportunity for shear-driven melting and mixing. As Essentra Components notes, the greater the L/D ratio, the more shear heat can be uniformly generated without degradation, and the greater the opportunity for mixing and melt homogeneity. A shorter L/D screw, by contrast, provides less processing length — and operators frequently compensate by cranking up back pressure to force the mixing that the screw geometry alone cannot deliver.
The takeaway? When you change screws — whether swapping to a different design, upgrading to a mixing-element screw, or moving production to a different machine with a different L/D — your previous back pressure settings are no longer valid. Re-evaluating this parameter after every screw change is not optional. Operators who skip this step are essentially running a different process while trusting the old recipe, and the result is often a string of unexplained quality shifts that trigger costly troubleshooting cycles.
When a Worn or Mismatched Screw Undermines Back Pressure Settings
Even when screw geometry is well-matched to the application, wear changes everything over time — and it does so gradually enough that the damage is easy to miss.
Think of it this way: back pressure only works if the melt is actually trapped ahead of the screw and forced through the channels under resistance. Three types of wear erode that containment:
- Screw-flight OD wear. As the outer diameter of the flights wears down, the radial clearance between screw and barrel increases. Melt leaks backward over the flights instead of being pushed forward under compression. The machine controller still displays the same pressure setting, but the melt experiences far less effective resistance. Industry research shows that this leakage flow intensifies with lower-viscosity resins, meaning materials like polypropylene lose effective back pressure faster than higher-viscosity polymers under the same wear conditions.
- Barrel bore wear. The barrel ID enlarges in high-pressure, high-temperature zones — primarily the transition section and the last few metering flights. This widens the same clearance gap from the other side, compounding the flight-wear problem.
- Check-ring (non-return valve) leakage. A worn check ring allows melt to leak backward during recovery, reducing the net volume and pressure of the shot accumulating ahead of the screw. The melt pool builds more slowly and at lower effective density, undermining exactly what back pressure is supposed to achieve.
Here is where the destructive feedback loop begins. An operator notices declining melt quality — perhaps color streaks, voids, or shot-weight variation — and responds by raising the back pressure setting on the controller. This compensates temporarily, masking the wear. But that higher setting forces even more melt over the already-enlarged flight clearance at elevated shear rates, which accelerates both flight OD wear and barrel bore wear. Melt temperature climbs from the extra shear. Recovery time stretches. And within weeks or months, the operator raises the setting again. Each adjustment buys a little time while making the underlying problem worse.
When screw or barrel wear reduces effective melt resistance, raising the back pressure setting on the controller does not restore process quality — it accelerates hardware degradation while masking the root cause.
Breaking this cycle requires addressing the hardware, not just the process setting. Practical strategies include:
- Periodic screw pulls and measurement. Recording flight OD dimensions at regular intervals creates a wear trend line. A common guideline flags replacement when radial clearance reaches roughly four times the original tolerance — though resin viscosity and quality requirements should inform that threshold.
- Check-ring inspection. Verifying shut-off performance during each pull helps catch leakage before it impacts shot consistency.
- Barrel bore gauging. Measuring the bore at high-wear zones identifies whether the barrel, the screw, or both need attention.
- Screw-geometry evaluation. Sometimes the original screw design was never ideal for the current resin or part. A mismatch between compression ratio and material characteristics can cause processors to rely on excessive back pressure from day one, wearing the equipment faster than a properly matched design would.
For molders dealing with recurring wear-related quality issues or processing resins that demand precise shear control — such as back pressure for flexible PVC injection molding, acetal, or glass-filled compounds — a purpose-matched screw and barrel combination often resolves problems that no amount of process parameter tuning can fix. Suppliers like NANHAIYA offer custom injection molding screw barrels engineered around specific machine specifications, resin characteristics, and shot requirements. Their technical review evaluates screw geometry, wear patterns, melting performance, mixing effectiveness, and material-retention concerns to match hardware to the application — directly targeting the root causes that force operators into that escalating back pressure cycle. This kind of application-matched approach is one practical path among a broader maintenance strategy, but it addresses the foundation rather than the symptoms.
The broader lesson is that what is back pressure in injection molding cannot be answered by looking at the controller alone. The screw translates that setting into real mechanical work on the polymer — and when the translator is worn, mismatched, or poorly designed, the signal gets lost. That reality becomes even more nuanced when you consider the machine platform itself, because hydraulic and electric presses generate and measure this resistance through fundamentally different mechanisms.
Hydraulic vs Electric Machines and Back Pressure Control
Have you ever transferred a mold from a hydraulic press to an electric one, punched in the same back pressure numbers, and watched the process fall apart? You are not alone. One of the most common — and most preventable — sources of confusion in any injection molding back pressure setup comes from the fundamental difference in how hydraulic and electric machines generate, regulate, and report this parameter. The number on your HMI screen can mean very different things depending on what is happening behind that display.
Back Pressure Control on Hydraulic Machines
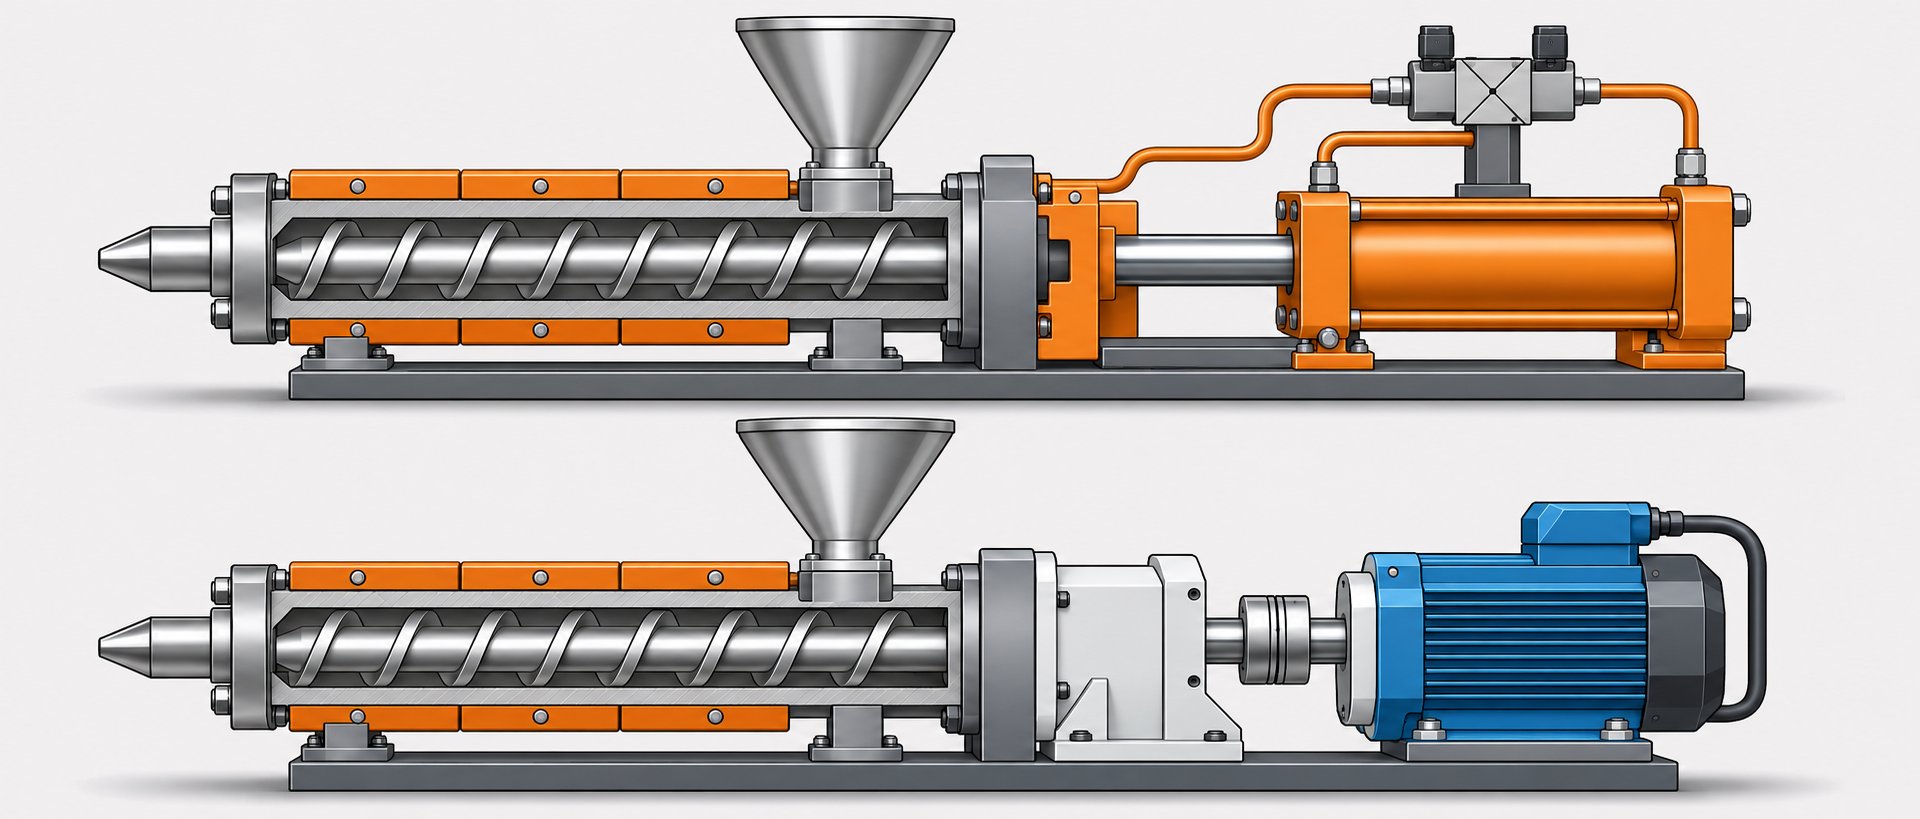
On a hydraulic injection molding machine, back pressure is created by restricting the flow of hydraulic oil out of the injection cylinder as the screw retracts. During recovery, the accumulating melt pushes the screw rearward, which in turn pushes a hydraulic piston. Oil must exit that cylinder to allow movement, and a proportional relief valve controls how freely it can escape. Tighten that valve, and the screw faces more resistance. Open it, and the screw slides back more easily.
Here is the catch that trips up countless operators: the pressure value displayed on the hydraulic machine's controller is hydraulic oil pressure, not the actual pressure the plastic melt experiences. The two are related, but they are not the same. Converting one to the other requires the machine's intensification ratio — the ratio of the hydraulic piston area to the screw-tip area.
Imagine a machine with an intensification ratio of 10:1. If the controller displays 60 psi of hydraulic back pressure, the melt in front of the screw is actually experiencing approximately 600 psi of plastic pressure. Set the same controller to 150 psi hydraulic, and the melt sees roughly 1,500 psi. That multiplier effect means a small change on the screen creates a large change at the screw tip — something operators accustomed to thinking in hydraulic units often underestimate.
Making matters more complicated, intensification ratios vary from machine to machine. As injection molding consultant John Bozzelli notes, ratios across the industry can range from 6:1 all the way to 43:1, and they are rarely clean whole numbers. Two hydraulic presses sitting side by side on the same production floor may have completely different ratios, which means identical hydraulic pressure settings produce very different melt conditions. If your plant runs multiple hydraulic machines, you cannot simply copy a back pressure value from one setup sheet to another without accounting for this difference.
Calibration drift adds yet another layer of uncertainty. Proportional relief valves wear over time, springs fatigue, and hydraulic oil viscosity shifts with temperature. A valve that reliably held 100 psi six months ago may now deliver 85 psi or 115 psi under the same electronic command. Unless the machine undergoes periodic pressure calibration — comparing the displayed value against actual hydraulic gauge readings — the number on the screen gradually becomes an approximation rather than a fact.
Back Pressure Control on Electric and Servo-Driven Machines
Electric (servo-driven) machines eliminate the hydraulic middleman entirely. Instead of restricting oil flow, a servo motor directly controls the screw's rearward movement by applying a braking torque. The motor resists the screw's retreat with precisely metered electrical force, and a pressure transducer mounted behind the screw drive mechanism measures the resulting force on the melt in real time.
This architectural difference delivers several practical advantages. First, the pressure reading on an electric machine's controller represents actual plastic pressure — specific pressure, as it is sometimes called — rather than hydraulic oil pressure. There is no intensification ratio to calculate. A display reading of 1,000 psi means the melt is experiencing approximately 1,000 psi at the screw tip. What you see is essentially what you get.
That directness explains why operators making the switch from hydraulic to electric are often startled by the numbers. A familiar 50 to 200 psi hydraulic back pressure setting translates to roughly 500 to 2,000 psi in plastic pressure terms on the electric machine. Bozzelli's recommendation for electric presses is to run between 1,000 and 1,500 psi plastic back pressure for general-purpose resins, reducing that range for easily degraded materials such as PVC or acetal. If you type in 100 psi on an electric press thinking you are setting back pressure the same way you did on your old hydraulic, you'll have virtually no melt resistance at all — and the resulting parts will show it.
Second, servo-driven control offers faster response times and higher repeatability. A servo motor can adjust braking torque within milliseconds, responding to real-time feedback from the pressure transducer. Hydraulic systems, by contrast, are inherently limited by oil compressibility, valve response lag, and fluid temperature effects. The practical result? Shot-to-shot consistency in screw recovery tends to be tighter on electric machines, which directly supports stable melt quality — especially important for shear-sensitive applications like back pressure for soft PVC injection molding or medical-grade compounds where process validation demands narrow tolerances.
Third, calibration is simpler and more stable. Servo motors do not suffer from the same drift mechanisms as hydraulic relief valves. The pressure transducer can be verified against a known standard, but it does not contend with fluid viscosity changes, spring fatigue, or valve seat wear. Over the typical service life of the machine, the displayed value remains closer to reality with less maintenance intervention.
Here is a side-by-side comparison that captures the key differences operators should understand when working across both platform types:
| Parameter | Hydraulic Machine | Electric (Servo-Driven) Machine |
|---|---|---|
| Control Mechanism | Proportional relief valve restricting hydraulic oil flow | Servo motor applying braking torque to screw drive |
| What the Display Shows | Hydraulic oil pressure (must multiply by intensification ratio for plastic pressure) | Actual plastic (specific) pressure at the screw tip |
| Measurement Accuracy | Indirect — subject to intensification ratio calculation and valve calibration | Direct — pressure transducer reads force on melt |
| Response Time | Slower — limited by oil compressibility and valve lag | Faster — servo adjusts torque within milliseconds |
| Calibration Requirements | Periodic valve and gauge checks; hydraulic oil condition monitoring | Transducer verification; less prone to drift |
| Typical Pressure Display Units | psi or bar (hydraulic); some machines also show calculated specific pressure | psi or bar (plastic/specific pressure directly) |
The bottom line for any back pressure injection molding machine setup: always confirm whether you are reading hydraulic pressure or plastic pressure before adjusting anything. Transferring settings between platforms without that translation is one of the fastest ways to produce off-spec parts on the first shot — and one of the easiest mistakes to prevent once you know what the numbers actually represent.
Machine type shapes how precisely you can control this parameter, but the resin in the barrel determines how much of it you actually need. Different polymer families respond to the same pressure setting in dramatically different ways — and getting those material-specific ranges right is where generic advice stops and real process optimization begins.
Material-Specific Back Pressure Guidelines by Resin Family
You could have perfect screw geometry, a freshly calibrated machine, and flawless mold design — and still produce rejects all day if your back pressure does not match the resin in the barrel. Every polymer family melts differently, degrades at different thresholds, and responds to shear in its own way. A setting that delivers crystal-clear polycarbonate lenses might destroy an acetal gear. One that works beautifully for unfilled nylon might snap every glass fiber in a reinforced compound.
That is why a one-size-fits-all pressure number is a myth. The back pressure injection molding process demands material-specific thinking. Below, you will find guidance organized by polymer family so you can quickly zero in on the range and the risks that apply to whatever resin you are running today.
Amorphous Resins Including ABS, PC, and PMMA
Amorphous polymers do not have a sharp melting point. Instead, they soften gradually over a broad temperature range, which generally makes them more forgiving during plasticating. Moderate back pressure — typically in the range of 80 to 150 psi hydraulic, depending on the machine's intensification ratio — is usually enough to achieve good melt homogeneity without excessive residence time.
ABS is a workhorse in this category. It mixes and melts readily, so moderate settings deliver consistent color dispersion and surface finish. Push the pressure too high, though, and the styrene component begins to degrade, producing a yellowish tint and reducing impact strength. One automotive supplier documented a case where ABS dashboard components required only an increase from 80 to 120 psi to eliminate silver streaking — proof that even small, targeted adjustments matter more than aggressive overcompensation.
Polycarbonate sits at the other end of the amorphous spectrum. Its high melt viscosity means the screw must work harder to generate a uniform melt pool. PC often benefits from moderate-to-higher back pressure settings to ensure consistent optical clarity and pigment distribution. Inadequate resistance leaves melt temperature variations of 15 to 20 degrees Fahrenheit across the shot — more than enough to cause optical distortion in clear parts or visible streaks in tinted ones. The trade-off is that PC's relatively long processing window tolerates this extra shear, so you have room to push higher without immediate degradation risk.
PMMA (acrylic) falls between the two. It requires enough mixing energy for crystal-clear transparency, but its thermal stability is narrower than PC. Moderate settings paired with careful melt temperature monitoring are the safest approach.
Semi-Crystalline Resins Including Nylon, POM, and PBT
Semi-crystalline materials behave very differently during plasticating. They do not soften gradually — they hold their solid structure until reaching a relatively sharp melting transition, then flow quickly once that threshold is crossed. This characteristic makes back pressure management more sensitive, because the boundary between "not enough shear" and "too much shear" is narrower.
Nylon (PA6 and PA66) is hygroscopic, meaning it absorbs moisture from the air. Even when pre-dried to specification, residual moisture and volatiles generated during melting need to be expelled during recovery. Higher back pressure — typically 150 to 200 psi for most nylon grades — creates the pumping action needed to force water vapor and trapped air rearward through the feed throat. Insufficient pressure almost always shows up as silver streaking from steam bubbles trapped in the melt.
POM (acetal) demands the opposite philosophy. This resin is one of the most thermally sensitive engineering polymers in common use. Excessive shear heating pushes POM past its relatively narrow processing window, triggering depolymerization that releases formaldehyde gas. The result? Surface defects, porosity, dimensional instability, and a distinct odor at the machine. Conservative back pressure settings — generally in the 80 to 120 psi range — keep shear-generated heat within safe limits. If you are tempted to increase the setting to chase better mixing, reconsider: a screw with appropriate compression ratio for POM will deliver homogeneity without relying on elevated resistance.
PBT (polybutylene terephthalate) occupies a middle ground. It melts cleanly at moderate settings and tolerates a reasonable processing window, but it remains sensitive to moisture. Adequate drying combined with moderate back pressure produces good results. The key risk with PBT is hydrolytic degradation if moisture content is above specification — a problem that higher pressure alone cannot solve and may actually worsen by extending residence time.
PVC and Flexible PVC Considerations
If there is one resin family where getting this setting wrong carries immediate and severe consequences, it is PVC. Both rigid and flexible (plasticized) PVC are among the most shear- and thermally sensitive commodity resins processed by injection molding. The polymer degrades by releasing hydrochloric acid (HCl) when exposed to excessive heat, and shear heating from elevated back pressure is a primary contributor to that thermal load.
For rigid PVC, back pressure is typically kept at the low end of the practical range — often just enough to ensure consistent screw recovery and minimal air entrapment. Operators who push the setting higher to improve mixing are playing a dangerous game: the additional shear heat can initiate a degradation cascade that corrodes barrel and screw surfaces, discolors the part, and releases corrosive fumes.
Flexible (soft) PVC formulations include plasticizers that lower the material's melt viscosity significantly. Because the melt flows more readily, less resistance is needed to achieve adequate mixing and compression. Back pressure for flexible PVC injection molding should be even more conservative than for rigid grades. The plasticizer itself can volatilize under excessive shear heating, creating bubbles and surface defects while altering the formulation's mechanical properties. If your flexible PVC parts are showing splay or discoloration, lowering back pressure is a safer first move than raising it.
Regardless of the PVC type, low-compression screws specifically designed for this resin family — with gentle shearing action and minimized dead spots — are essential. Relying on back pressure to compensate for a general-purpose screw in a PVC application is a recipe for barrel corrosion and chronic quality issues.
Filled, Reinforced, and Specialty Compounds
Glass-fiber-reinforced and mineral-filled compounds introduce a mechanical variable that unfilled resins do not: the integrity of the reinforcement itself. Every pass of the melt through the screw channels under elevated shear subjects fibers to bending and breakage forces. The higher your back pressure, the more aggressive that shear environment becomes.
A study published in Polymers quantified this trade-off using long-glass-fiber-reinforced polypropylene. Researchers found that increasing back pressure from 0 to 0.7 MPa maintained average fiber length around 10 mm while reducing air trap volume fraction — and tensile strength actually increased because the dominant factor was void reduction. But pushing the pressure further to 1.12 MPa caused fiber length to drop dramatically to around 5 mm, cutting tensile strength despite even lower void content. The study concluded that fiber breakage was dominated by back pressure and screw speed, and that appropriate parameter settings could maintain fiber length above 10 mm.
The practical implication? For glass-filled compounds, you need enough back pressure to distribute fibers evenly and expel trapped air — but not so much that you shear-shorten the reinforcement. Industry experience suggests moderate settings in the 100 to 150 psi range for most glass-filled grades, with 30% glass-filled nylon being particularly sensitive. Testing on 30% GF nylon showed that excessive back pressure above 180 psi reduced average fiber length from 200 microns to 85 microns, cutting tensile strength by 25%.
Mineral-filled compounds (talc, calcium carbonate, mica) are less susceptible to reinforcement damage because the particles are not elongated, but they still benefit from moderate mixing pressure to ensure uniform dispersion. Specialty compounds — including liquid crystal polymers, high-temperature sulfone resins, and bio-based blends — each carry unique sensitivities that demand pilot testing rather than assumed settings.
The following table consolidates these material-specific tendencies into a quick-reference format you can use at the press:
| Resin Family | General Back Pressure Tendency | Primary Concern | Key Processing Notes |
|---|---|---|---|
| ABS | Moderate | Mixing / color dispersion | Moderate settings handle most applications; avoid excess to prevent yellowing |
| Polycarbonate (PC) | Moderate to High | Melt uniformity / optical clarity | High viscosity benefits from elevated settings; wide thermal window provides safety margin |
| PMMA (Acrylic) | Moderate | Clarity / thermal sensitivity | Requires good mixing for transparency; narrower thermal window than PC |
| Nylon (PA6 / PA66) | Moderate to High | Moisture removal / degassing | Hygroscopic — needs sustained pressure to expel moisture; pre-drying essential |
| POM (Acetal) | Low to Moderate | Thermal degradation / formaldehyde generation | Narrow processing window; use low-compression screws; minimize shear heating |
| PBT | Moderate | Moisture sensitivity / hydrolysis | Drying is critical; moderate pressure with controlled residence time |
| Rigid PVC | Low | Thermal degradation / HCl release | Extremely shear-sensitive; use PVC-specific screws; minimize residence time |
| Flexible (Soft) PVC | Very Low | Plasticizer volatilization / degradation | Lower viscosity requires less mixing energy; excess shear volatilizes plasticizers |
| PP / PE | Low to Moderate | Over-shearing / degradation at high settings | Low viscosity melts easily; 50-80 psi typical; excess pressure extends cycle without benefit |
| PET | Moderate to High | Moisture / IV degradation | Even 0.02% moisture causes haze; high pressure aids degassing if material is properly dried |
| Glass-Fiber Reinforced | Moderate (carefully controlled) | Fiber breakage vs. dispersion | Balance mixing with fiber integrity; excess pressure drastically reduces fiber length and strength |
| Mineral-Filled | Moderate | Filler dispersion | Particles resist breakage but need uniform distribution; moderate pressure sufficient |
Keep in mind that these are starting-point tendencies, not fixed rules. Resin grade, colorant type, filler loading, moisture content, and even seasonal humidity shifts can all move the target. One documented case found that nylon 66 applications required 140 psi during winter months versus 170 psi in summer humidity — a 30 psi swing driven entirely by ambient conditions. The safest approach is to treat these ranges as a launchpad for systematic testing rather than a destination.
Knowing which direction to adjust for each resin family is valuable. But knowing why a particular defect is appearing — and whether the root cause traces back to too much or too little resistance — is what turns material knowledge into production-floor problem-solving. That diagnostic connection between defect symptoms and back pressure causes is where theory meets the reject bin.
Troubleshooting Part Defects Linked to Back Pressure
A reject lands on your inspection table. Maybe it is a burn mark near the gate, a cluster of silver streaks along a rib, or a stubborn color swirl that ruins an otherwise perfect cosmetic surface. Your instinct might be to start adjusting fill speed or hold pressure — but if the defect originated during screw recovery, those corrections will never reach the root cause. The back pressure study injection molding professionals rely on starts with a simple diagnostic question: is the melt being overworked, or underworked, before it ever enters the cavity?
Answering that question requires connecting the visual evidence on the part to the molecular-level mechanism inside the barrel. Here is how specific defects trace back to excessive or insufficient resistance during plasticating — and what to do about each one.
Defects Caused by Excessive Back Pressure
When resistance during recovery is too high, the screw overworks the melt. Extra shear energy converts to heat, residence time stretches, and thermally sensitive polymer chains begin to break down. The defects that result share a common origin: the plastic was damaged before injection even started.
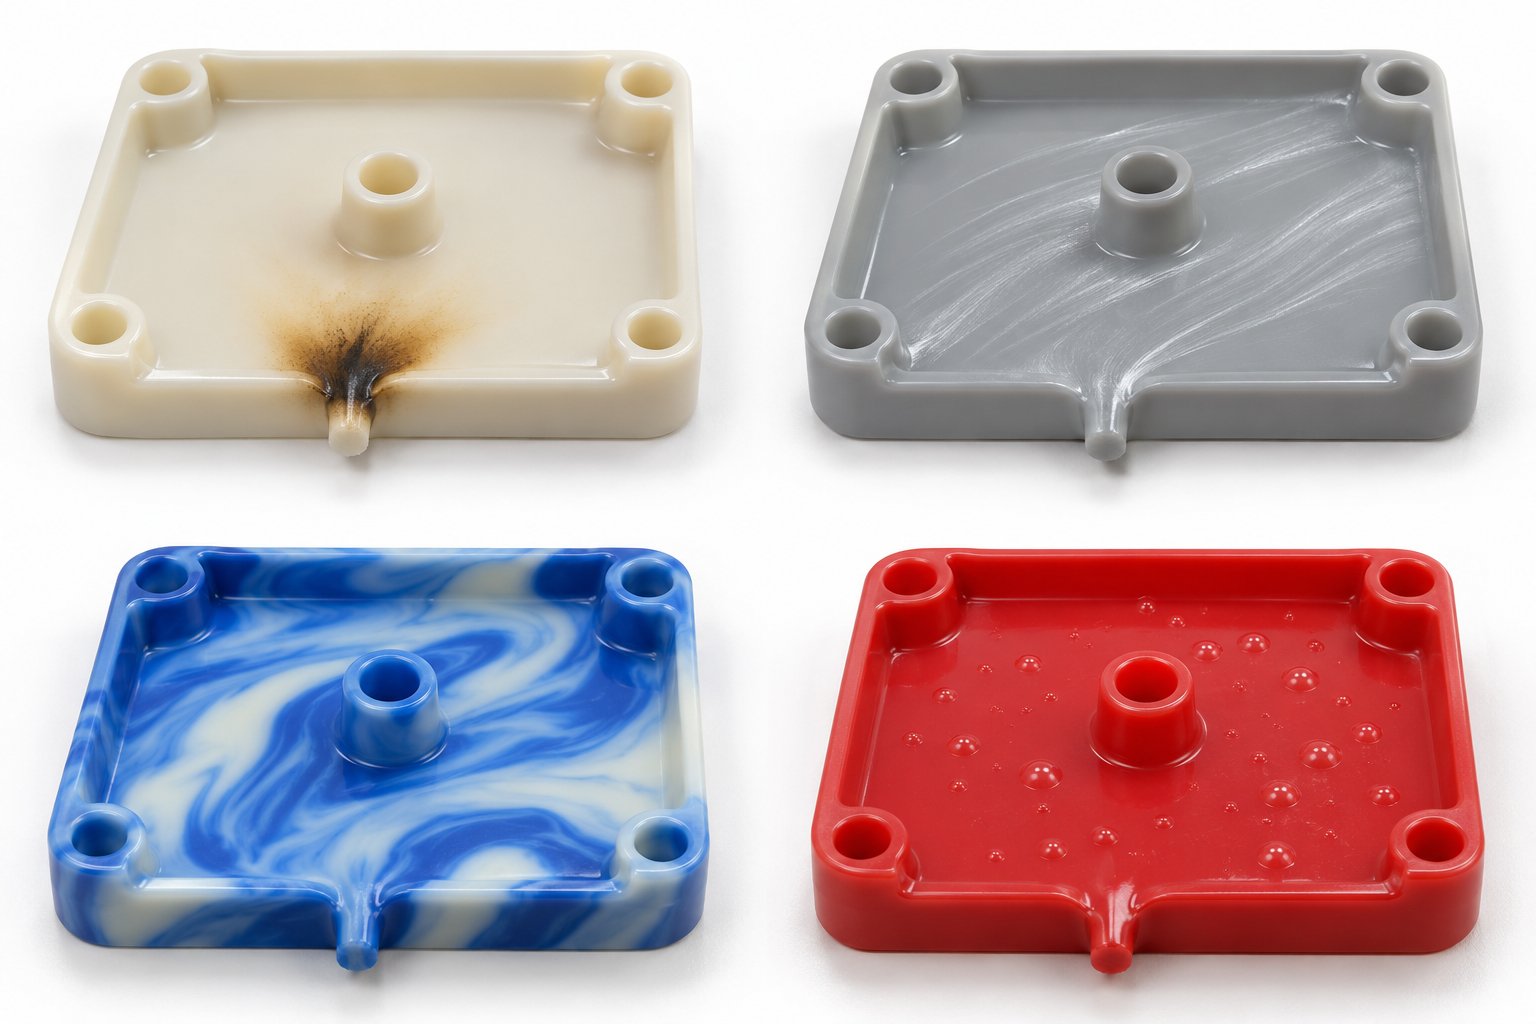
- Burn marks. These appear as dark brown or black discolorations, often near the gate or in thin-wall sections. The mechanism is straightforward — excessive shear heating pushes the melt temperature past the resin's thermal stability limit. Extended residence time compounds the problem because degraded material accumulates in the barrel and gets injected with each subsequent shot. Thermal degradation silver streaks frequently accompany burn marks, appearing as comet-shaped discolorations along the sprue. Corrective direction: reduce back pressure incrementally, lower barrel temperatures in the metering zone, and verify that shot size is large enough to avoid excessive residence time.
- Flash. You might not immediately associate flash with back pressure in plastic injection molding, but the connection is real. Elevated resistance during recovery raises the residual melt-front pressure carried into the injection phase. That higher baseline pressure, combined with normal fill pressure, can exceed the clamp force needed to keep the mold sealed — especially at parting-line edges or around thin vents. Corrective direction: lower back pressure and verify that clamp tonnage is adequate for the resulting cavity pressure.
- Splay and silver streaks from volatiles. When shear heating pushes degradation-sensitive resins like PVC or POM past their thermal processing window, the polymer decomposes and releases gaseous byproducts — hydrochloric acid from PVC, formaldehyde from POM. These volatiles become trapped in the melt and erupt at the flow front during filling, leaving characteristic V-shaped silver streaks radiating outward from the gate. As FirstMold's analysis of splay marks confirms, thermal degradation streaks often do not follow a specific pattern and may be accompanied by darkening of the sprue — a telltale indicator that the problem started in the barrel, not the mold. Corrective direction: reduce back pressure, confirm material drying, and consider whether the screw design is generating excessive shear for the resin being processed.
- Discoloration. Yellowing, browning, or uneven tinting appears when either the base resin or the pigment system thermally degrades. High back pressure is a frequent contributor because the additional shear energy raises true melt temperature well beyond barrel setpoints. Pigments designed for a specific temperature range lose color accuracy or shift hue when overheated. Corrective direction: reduce back pressure, lower melt temperature, and shorten residence time by optimizing shot-to-barrel-capacity ratio.
Defects Caused by Insufficient Back Pressure
At the other extreme, too little resistance lets the screw recover quickly — but the melt it delivers is poorly prepared. Air remains trapped, pigment stays clumped, and melt density varies from shot to shot. The defects here reflect a lack of mixing and compression rather than thermal abuse.
- Unmelted particles or gels. When resistance is too low, pellets pass through the screw channels without enough shear work to fully melt their cores. The result is visible as translucent specks, hard spots, or gel-like inclusions embedded in the part surface. These unmelts compromise both appearance and mechanical integrity. Corrective direction: increase back pressure in small increments while monitoring screw recovery time; also verify that barrel zone temperatures are adequate and that the screw's compression ratio is appropriate for the resin.
- Voids and bubbles. Air enters the barrel between pellets during feeding. Adequate back pressure compresses the melt and forces trapped gas rearward through the feed throat during recovery. Without that compaction, air pockets survive and travel forward into the shot. They appear as internal voids in thick sections or surface bubbles near ribs and bosses. JeekMould notes that air between pellets or inside poorly compacted material may not be removed or compressed consistently when resistance is low, leading directly to these defects. Corrective direction: raise back pressure gradually to improve melt density, and verify that decompression (suck-back) settings are not introducing additional air after recovery completes.
- Color streaks. Poor distributive mixing of colorant — whether masterbatch, liquid color, or regrind blend — produces visible streaks, swirls, or shade variation on the part surface. The screw simply did not work the material long enough or hard enough to disperse the pigment evenly through the carrier resin. Corrective direction: increase back pressure to improve mixing energy, check masterbatch letdown ratio and dosing consistency, and evaluate whether a mixing-element screw would reduce reliance on elevated pressure.
- Shot-to-shot inconsistency. Variable melt density from one recovery stroke to the next means each shot delivers a slightly different volume and packing potential into the cavity. Part weight drifts. Dimensions shift. Surface quality varies cycle to cycle even when every other parameter holds steady. This is one of the most frustrating production issues to chase because the root cause — inconsistent melt preparation — hides upstream of every diagnostic the operator typically checks first. Corrective direction: increase back pressure to stabilize melt density and improve screw recovery repeatability; also inspect the check ring for leakage that could be compounding the variation.
To define back pressure in injection molding troubleshooting terms, it is the variable that determines whether the melt arrives at the injection phase in a state ready to produce good parts — or in a state that guarantees defects no matter how well you tune fill, pack, and cool. The table below consolidates these defect-cause-correction relationships into a single quick-reference format you can print and post at the press.
| Defect Name | Visual Indicator | Likely Back Pressure Cause | Mechanistic Explanation | Recommended Corrective Action |
|---|---|---|---|---|
| Burn Marks | Dark brown or black spots, often near gate or thin walls | Too High | Excessive shear heating and extended residence time push resin past thermal stability limit, causing molecular decomposition | Reduce back pressure incrementally; lower metering zone temperature; verify shot-to-barrel ratio to reduce residence time |
| Flash | Thin film of excess material along parting line or vent areas | Too High | Elevated residual melt-front pressure from over-compacted recovery adds to injection pressure, exceeding clamp force at mold sealing surfaces | Lower back pressure; confirm clamp tonnage is adequate; inspect mold parting surfaces for wear |
| Splay / Silver Streaks (thermal) | V-shaped or comet-shaped shiny streaks radiating from gate, sometimes with sprue darkening | Too High | Shear-driven overheating degrades polymer, releasing gaseous byproducts (HCl from PVC, formaldehyde from POM) that erupt at the flow front | Reduce back pressure; lower barrel temperatures; evaluate screw design for excessive shear; check material drying |
| Discoloration | Yellowing, browning, or hue shift across part surface or in sprue | Too High | Thermal degradation of base resin or pigment system from shear-elevated melt temperature exceeding the colorant's stability range | Reduce back pressure; lower melt temperature; shorten residence time; verify pigment system thermal rating |
| Unmelted Particles / Gels | Translucent specks, hard spots, or gel-like inclusions on or near part surface | Too Low | Inadequate shear and compression during recovery leave pellet cores unmelted; material passes forward without sufficient mechanical energy input | Increase back pressure gradually; verify barrel temperatures; assess screw compression ratio and condition |
| Voids / Bubbles | Internal voids in thick sections; surface bubbles near ribs or bosses | Too Low | Trapped air between pellets is not expelled during recovery due to insufficient melt compaction; gas pockets carry forward into the shot | Raise back pressure to improve melt density; check decompression settings; confirm material drying for hygroscopic resins |
| Color Streaks | Visible swirls, bands, or shade variation on part surface | Too Low | Poor distributive mixing leaves masterbatch or pigment unevenly dispersed through the carrier resin during inadequate screw recovery | Increase back pressure; verify masterbatch dosing ratio; evaluate mixing-element screw if problem persists |
| Shot-to-Shot Inconsistency | Drifting part weight, shifting dimensions, variable surface quality cycle to cycle | Too Low | Variable melt density from inconsistent compression during recovery produces different packing volumes each cycle | Increase back pressure to stabilize melt density; inspect check ring for leakage; monitor screw recovery time for repeatability |
Print this table, laminate it, and keep it within reach of every press operator running a back pressure study on a new mold or material. It will not replace systematic scientific molding methodology — but it gives your team a reliable first-pass filter to separate pressure-related defects from issues rooted elsewhere in the process. And that distinction matters, because the real payoff comes from not just identifying the right direction to adjust, but from following a structured, data-driven procedure that pinpoints the exact setting where melt quality and cycle efficiency meet.
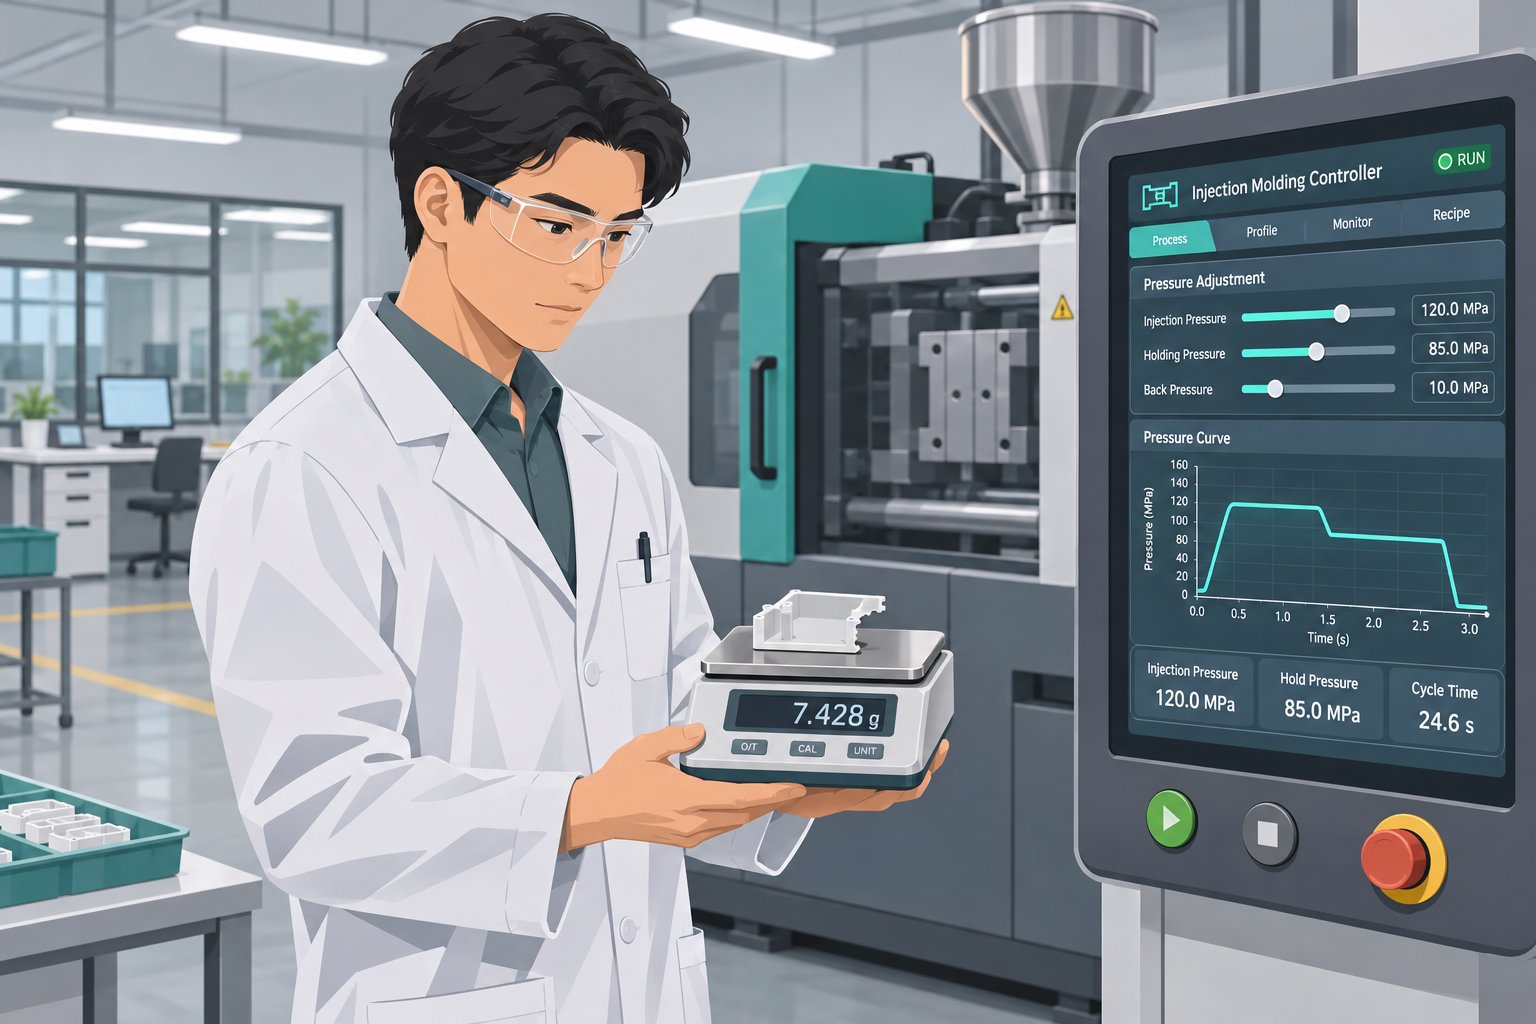
How to Set Back Pressure Using a Scientific Molding Approach
Knowing which defects point to too much or too little resistance is valuable — but it still leaves a fundamental question unanswered: where, exactly, should you set the number? "Start low and adjust until it looks right" is the advice most processors receive, and it is about as useful as telling a pilot to "fly until you get there." You need a destination, a flight plan, and instruments to read along the way.
Scientific molding replaces gut feeling with measurable data. The effect of back pressure in injection molding shows up in two things you can quantify at every setting: shot weight consistency and screw recovery time. By systematically testing one against the other, you can identify the exact point where melt quality is optimized without wasting cycle time or over-shearing the resin. Here is how to do it.
A Step-by-Step Back Pressure Optimization Procedure
This procedure isolates back pressure from every other variable in the process. It borrows directly from the methodology outlined by Suhas Kulkarni of Fimmtech and adapts it into a repeatable sequence any molder can execute on the production floor.
- Eliminate pack and hold influence. Set your pack and hold pressures to zero. You want "fill only" or "injection only" shots — short shots that fill roughly 75% of the cavity. This ensures that any variation in shot weight reflects melt density differences from recovery, not packing behavior. Adjust the transfer position to achieve that partial fill before you begin.
- Start at the lowest practical back pressure setting. For most hydraulic machines, this means roughly 25 psi hydraulic (or the equivalent in plastic pressure on an electric press). Purge several shots to stabilize the process at this baseline.
- Collect and weigh melt samples. Mold 10 consecutive shots at the starting setting. Collect each complete shot — all parts plus the runner — and weigh them individually on a precision scale. Record the highest weight, the lowest weight, and calculate the range (highest minus lowest). This range is your primary metric for melt density consistency.
- Incrementally increase back pressure in consistent steps. Raise the setting by a fixed increment — 25 psi hydraulic is a common step size. Allow the process to stabilize for several cycles, then collect another 10 shots and repeat the weighing procedure. Continue stepping upward through your expected operating range.
- Record screw recovery time and melt temperature at each step. Most machine controllers display recovery time automatically. If your machine has a melt temperature probe or you can perform air shots for pyrometer readings, capture actual melt temperature as well. These secondary data points reveal the cost of each incremental pressure increase — longer cycle contribution and higher thermal load on the resin.
- Identify the inflection point. Plot your weight range data against back pressure settings. You will typically see the range decrease as pressure increases — the melt is getting more consistent. At some point, the range reaches a minimum and levels off or begins to rise again. Kulkarni explains that this upturn occurs because the plastic starts to slip on the screw flights under excessive resistance, reintroducing inconsistency from the very mechanism meant to prevent it. That valley — the lowest range — marks your sweet spot.
- Set your operating back pressure just above the minimum required for acceptable melt quality. If the data shows a plateau of low range values across several pressure steps — say, 500 to 700 psi plastic pressure all produce similarly tight ranges — choose a setting on the lower end of that window. You get the melt consistency you need while minimizing recovery time, shear heating, and mechanical wear.
Why start with fill-only shots instead of complete parts? Because pack and hold pressure mask melt density variation. A fully packed part can appear dimensionally acceptable even when the melt feeding it was inconsistent — the packing phase compensates for the deficit. By removing that safety net, you expose the true state of your melt preparation and let the data speak without interference.
Weight equals volume multiplied by density. If the shot volume is fixed and the cushion is consistent, then shot weight variation directly reflects melt density variation — the very thing back pressure controls.
One practical note: this study is time-consuming. You do not necessarily need to run it every time you set up a mold. But performing it at least once per material family on each machine gives you a documented, data-driven baseline that replaces guesswork for every future setup. Think of it as an investment that pays dividends across hundreds of production runs.
Using a Screw Recovery Study to Validate Settings
The weight-range procedure tells you where melt consistency peaks. A screw recovery study tells you what that consistency costs in cycle time — and together, the two datasets let you make an informed engineering decision rather than an emotional one.
The approach is straightforward. At each back pressure increment from your optimization study, record the screw recovery time — the elapsed seconds from the start of screw rotation to the point where the screw reaches its target shot-size position. Plot recovery time on one axis and back pressure on the other. You will see a curve that rises gradually at first, then steepens as higher resistance forces the screw to work progressively harder against the melt.
Now overlay this curve with your weight-range data. The ideal operating point sits where melt consistency has reached its plateau but recovery time has not yet entered its steep climb. This is the region where you are getting full value from the pressure you are applying — every psi is improving the melt. Beyond that inflection, additional resistance adds seconds to every cycle with no measurable improvement in shot quality.
Why does recovery time matter so much? Because in many production scenarios, screw recovery runs in parallel with part cooling. As long as recovery finishes before the cooling timer expires, it does not add to your overall cycle. But the moment recovery time exceeds cooling time, it becomes the cycle-limiting step — and every extra second goes straight onto your per-part cost. A recovery study lets you see exactly how close you are to that boundary and whether your current setting has already crossed it.
For processors running high back pressure injection molding settings on viscous resins like polycarbonate or glass-filled nylon, this crossover is common. The screw simply cannot recover fast enough at elevated resistance, and the machine sits idle waiting for plasticating to complete. A recovery study often reveals that reducing the setting by a modest amount — 100 to 200 psi of plastic pressure — shaves one to three seconds per cycle with no detectable change in part quality. On a 24-hour production run at 20-second cycles, that adds up fast.
This data-driven methodology does more than optimize individual molds. It integrates directly into the formal process validation framework that regulated industries — medical devices, automotive safety components, aerospace — require before a mold enters commercial production. The three-phase validation sequence known as IQ, OQ, and PQ (Installation Qualification, Operational Qualification, and Process Qualification) demands documented evidence that each critical parameter has been evaluated and set within a defensible range.
A back pressure optimization study feeds directly into OQ, where the goal is to establish the upper and lower operating limits for all variables that affect part quality. Your weight-range data defines the acceptable window. Your recovery-time data defines the practical limits. Together, they give you a documented process parameter range that auditors, quality engineers, and customers can review with confidence.
During PQ, where production runs prove that the process consistently produces parts within specification, the back pressure baseline from your study anchors one of the most influential — and often least documented — parameters in the entire molding cycle. Without it, you are asking a quality system to validate a setting that was chosen by instinct. With it, you are providing statistical evidence that the setting was chosen by measurement.
Whether you are molding Class III medical devices under FDA oversight or consumer electronics where cosmetic consistency drives customer perception, the approach is the same: measure, plot, document, decide. The numbers do not lie, they do not forget, and they do not change their story when a different operator starts the next shift.
Dialing in the right setting through structured testing is where process quality begins. But quality improvements only matter if they translate into results the business can see on its balance sheet — and the connection between this single parameter and your plant's throughput, scrap rate, and energy bill is more direct than most production managers realize.
Back Pressure Effects on Cycle Time and Production Economics
A process engineer proves that a modest reduction in back pressure shaves 1.5 seconds off screw recovery without affecting melt quality. On a 22-second cycle running 24 hours a day, that change produces an additional 245 parts per shift. Multiply that across three shifts, five days a week, and you are looking at thousands of extra parts per month — from a single parameter adjustment that cost nothing to implement. That is the importance of back pressure in injection molding viewed through a production manager's lens: every psi either earns money or burns it.
Recovery Time, Cycle Time, and Throughput Impact
Here is the key relationship most operators understand intuitively but rarely quantify: every increment of back pressure increases screw recovery time. The screw must work harder against the melt, rotating more turns before accumulating enough material ahead of the check ring to reach the target shot-size position. A little extra resistance might add a fraction of a second. A lot of extra resistance can add several seconds — and that is where the economics change dramatically.
In a well-balanced cycle, screw recovery happens while the part cools inside the mold. Cooling time is typically the longest segment, and as long as recovery finishes before the cooling timer expires, it runs "for free" — hidden inside the cycle without adding a single second to the clock. The machine opens, ejects, closes, and injects the next shot without ever waiting on the screw.
But imagine you raise the setting to chase slightly better color dispersion or melt uniformity. Recovery time creeps from 6 seconds to 9 seconds. If your cooling time is 8 seconds, recovery just became the cycle-limiting step. The machine finishes cooling, the mold is ready to open — and the press sits idle for a full second waiting for the screw to finish plasticating. That idle second is pure lost output.
How do you know whether recovery time is currently on or off the critical path? Check two numbers on your controller: the set cooling time and the actual screw recovery time. If recovery consistently finishes one to two seconds before the cooling timer expires, you have margin. If the two numbers are neck and neck — or if recovery occasionally exceeds cooling — you are either already losing throughput or one small process drift away from doing so.
The sensitivity can be surprising. UL Prospector notes that increasing back pressure often pushes recovery time beyond the allowed cooling time, which in turn lengthens the overall cycle because the machine will not open the clamp until the screw reaches shot size. To compensate, operators raise screw RPM — which introduces additional shear heating and its own cascade of quality risks. You end up adjusting two parameters to fix a problem that one parameter created, and the process moves further from its validated baseline with every correction.
Scrap Reduction and Material Savings from Optimized Settings
Cycle time grabs the headlines, but scrap reduction often delivers the bigger financial payoff — especially in operations running engineering resins where material cost per kilogram is substantial.
Consider what happens when back pressure is systematically optimized using the scientific molding approach described earlier. Voids disappear because the melt is properly compacted. Color streaks vanish because pigment dispersion reaches an acceptable threshold. Unmelted particles stop showing up because the screw delivers enough shear work to fully plasticize every pellet. Shot-to-shot weight variation tightens, which means dimensions stabilize and the process stays centered within specification limits rather than drifting toward reject territory.
Each of those quality improvements removes parts from the scrap bin — parts that previously consumed raw material, machine time, and energy without producing a single sellable unit. The downstream savings multiply quickly:
- Material waste. Every rejected part represents resin that was purchased, dried, conveyed, melted, and molded for nothing. For glass-filled or specialty compounds costing $5 to $15 per kilogram, even a modest scrap reduction from 4% to 2% saves thousands of dollars annually on a high-volume mold.
- Cycle time. When recovery is balanced against cooling time rather than exceeding it, throughput increases without capital investment. Parts-per-hour goes up while cost-per-part goes down.
- Energy consumption. Higher back pressure demands more motor torque during recovery — whether from a hydraulic pump working against a tighter relief valve or a servo motor applying greater braking force. Reducing the setting to the minimum effective level directly lowers the energy input per shot. Across millions of cycles per year, the kilowatt-hour savings are measurable.
- Scrap rate and rework. Lower reject rates mean fewer secondary quality inspections, less regrind processing, and reduced risk of contaminating virgin material streams with degraded regrind. Operations running zero-regrind policies for medical or optical parts benefit even more, because every scrap part is a total material loss.
- Overall equipment effectiveness (OEE). OEE combines availability, performance, and quality into a single metric. Optimized back pressure improves two of those three pillars simultaneously — performance (faster effective cycle) and quality (fewer rejects) — making it one of the highest-leverage process adjustments available without touching tooling or machine hardware.
Production managers evaluating capital requests for new molds, auxiliary equipment, or automation often overlook the returns available from process parameter optimization. A single back pressure study, executed once per material-machine combination and documented for every future setup, can deliver a measurable improvement in OEE that rivals the benefit of far more expensive interventions. The injection molding back pressure definition may describe a simple resistance setting — but its financial footprint extends across every cost center on the production floor.
These economics make a compelling case for treating plasticating optimization as a strategic priority rather than a set-and-forget afterthought. Yet even the best-tuned process parameters have limits when the hardware underneath them is worn, mismatched, or never designed for the resin and part being produced. The final piece of the puzzle is aligning the entire plasticizing system — screw, barrel, and process — into a single, coherent optimization strategy.
Optimizing the Plasticizing System for Consistent Back Pressure Performance
Think about every topic covered in this article — shear heating, resin-specific sensitivity, hydraulic versus electric control, defect diagnostics, scientific molding studies — and you will notice a common thread running through all of them. The purpose of back pressure in injection molding is not just to squeeze the melt harder. It is to prepare a uniform, air-free, thermally consistent shot that fills your cavity the same way every single cycle. But that outcome depends entirely on the hardware translating your controller setting into real mechanical work on the polymer.
Matching the Plasticizing Unit to Your Process Requirements
Back pressure is not an isolated number you can optimize in a vacuum. It is one variable inside a system that includes screw geometry, barrel condition, resin characteristics, and machine type. Change any one of those elements, and the "right" setting shifts with it.
Imagine spending hours running a meticulous screw recovery study, documenting the ideal pressure for your polycarbonate blend, only to discover six months later that barrel bore wear has widened the flight clearance enough to slash effective melt resistance by 30%. The controller still shows the same number. The melt sees something very different. Your documented baseline is now fiction.
This is why optimizing back pressure on a worn or mismatched screw yields limited returns. You are fine-tuning a process variable while the hardware underneath it drifts in the opposite direction. Addressing that foundation — confirming that the screw's compression ratio matches the resin, that flight dimensions are within tolerance, and that the check ring seals reliably — often unlocks quality and consistency improvements that settings alone cannot achieve. Research published in Polymers demonstrated that optimized back pressure reduced plasticizing work by 46% and torque by 24% while simultaneously improving mechanical properties and process stability — but those gains were only possible because the plasticizing hardware was properly matched to the application from the start.
Building a Long-Term Back Pressure Optimization Strategy
Sustainable results come from combining scientific molding methodology with periodic evaluation of your plasticizing hardware. Neither approach works well alone. Data-driven process studies lose their validity when screw condition deteriorates, and new hardware cannot deliver its potential if the process settings around it were never properly characterized.
Here is an actionable checklist you can implement starting this week:
- Conduct a screw recovery study for every active mold-material combination. Document the weight-range-versus-pressure curve and the recovery-time-versus-pressure curve. Store these as your validated baselines.
- Document baseline back pressure settings on each setup sheet, specifying whether the value is hydraulic or plastic pressure and noting the machine's intensification ratio where applicable.
- Inspect screw and barrel wear annually — or more frequently for abrasive compounds. Record flight OD dimensions, barrel bore measurements, and check-ring shut-off performance. Trend these values over time so you can predict replacement timing instead of reacting to quality failures.
- Evaluate whether current screw geometry matches current resin and part requirements. Production evolves — new materials get qualified, color requirements change, regrind ratios shift. A screw that was ideal three years ago may no longer be the right fit.
- Review machine calibration. For hydraulic presses, verify that displayed pressure values match actual gauge readings at least once per year. For electric machines, confirm transducer accuracy during routine maintenance cycles.
When wear patterns or resin changes indicate that your current screw and barrel are no longer matched to the application, sourcing purpose-built replacements is often the most cost-effective path forward. NANHAIYA's custom injection molding screw barrels are manufactured around specific machine specifications, resin characteristics, and shot requirements. Their technical review evaluates screw geometry, wear history, melting performance, mixing effectiveness, and material-retention concerns — aligning the hardware to your actual production needs rather than defaulting to a general-purpose design. For molders building a shot with an injection molding screw where back pressure consistency is critical, that kind of application-matched approach addresses the mechanical foundation before you ever touch a process parameter.
The bottom line? Back pressure is a powerful lever, but it is only as effective as the system behind it. A disciplined optimization strategy — one that pairs scientific process studies with proactive hardware evaluation — transforms this often-overlooked setting from a source of hidden cost into a reliable driver of quality, throughput, and profitability. Start with the data, maintain the hardware, and let the process do what it was designed to do: produce good parts, every cycle, every shift.
Frequently Asked Questions About Injection Molding Back Pressure
1. What is a good back pressure setting for injection molding?
A good starting point for most general-purpose resins is 500 to 1,000 psi of specific (plastic) pressure, which translates to roughly 50 to 150 psi on hydraulic machines depending on the intensification ratio. However, the ideal setting varies by resin family: thermally sensitive materials like PVC and POM need the low end of that range, while high-viscosity polymers like polycarbonate often benefit from moderate-to-higher settings. The most reliable approach is running a scientific molding screw recovery study — collecting short-shot weights at incremental pressure steps — to pinpoint the exact setting where melt density consistency peaks without extending recovery time beyond your cooling window.
2. What happens if back pressure is too high in injection molding?
Excessive back pressure forces the screw to over-shear the melt, converting mechanical energy into heat that raises actual melt temperature well above barrel setpoints. This can trigger polymer chain scission, off-gassing, and thermal degradation that shows up as burn marks, yellowing, silver streaks, or flash on finished parts. Recovery time also increases, potentially becoming the cycle-limiting step and reducing parts-per-hour output. For degradation-prone resins such as POM, high back pressure can generate formaldehyde gas, while PVC may release corrosive hydrochloric acid — both of which damage barrel and screw surfaces in addition to ruining parts.
3. What happens if back pressure is too low in injection molding?
Insufficient back pressure allows the screw to retract too easily, meaning the melt receives inadequate shear work and compression. Common consequences include unmelted pellet cores appearing as hard specks in parts, trapped air surviving as voids or bubbles, poor color dispersion causing visible streaks, and inconsistent melt density leading to shot-to-shot weight variation. These defects originate during the plasticating phase and cannot be corrected by adjusting fill speed, pack pressure, or cooling time downstream.
4. How does back pressure differ between hydraulic and electric injection molding machines?
On hydraulic machines, back pressure is created by restricting hydraulic oil flow through a relief valve, and the controller displays hydraulic oil pressure — not actual plastic pressure. You must multiply the displayed value by the machine's intensification ratio (which can range from 6:1 to over 40:1) to determine what the melt actually experiences. On electric servo-driven machines, a motor applies braking torque directly to the screw, and the controller displays actual plastic pressure with no conversion needed. This means identical numeric settings produce very different melt conditions across machine types, making it critical to confirm which pressure unit your display is showing before transferring process settings between platforms.
5. Does screw wear affect back pressure performance in injection molding?
Yes, significantly. As screw flights wear down and barrel bore dimensions enlarge, the radial clearance between screw and barrel increases. Melt leaks backward over the worn flights instead of being pushed forward under compression, so the polymer experiences far less effective resistance than the controller setting indicates. A worn check ring compounds the problem by allowing melt to flow backward during recovery. Operators often compensate by raising back pressure on the controller, which temporarily masks the wear but accelerates further degradation in a destructive feedback loop. Periodic screw pulls, flight measurements, barrel bore gauging, and check-ring inspection are essential to catch this issue before it undermines process quality. Suppliers like NANHAIYA offer custom injection molding screw barrels engineered to match specific machine and resin requirements, providing an application-matched solution when wear or geometry mismatch is the root cause.
Written by
Nanhaiya Technical Team
Zhoushan Nanhaiya Plastic Machinery Co., Ltd.
The Nanhaiya technical team supports screw and barrel manufacturing projects through application review, technical communication, custom manufacturing coordination, and production and quality control.
Discuss Your Application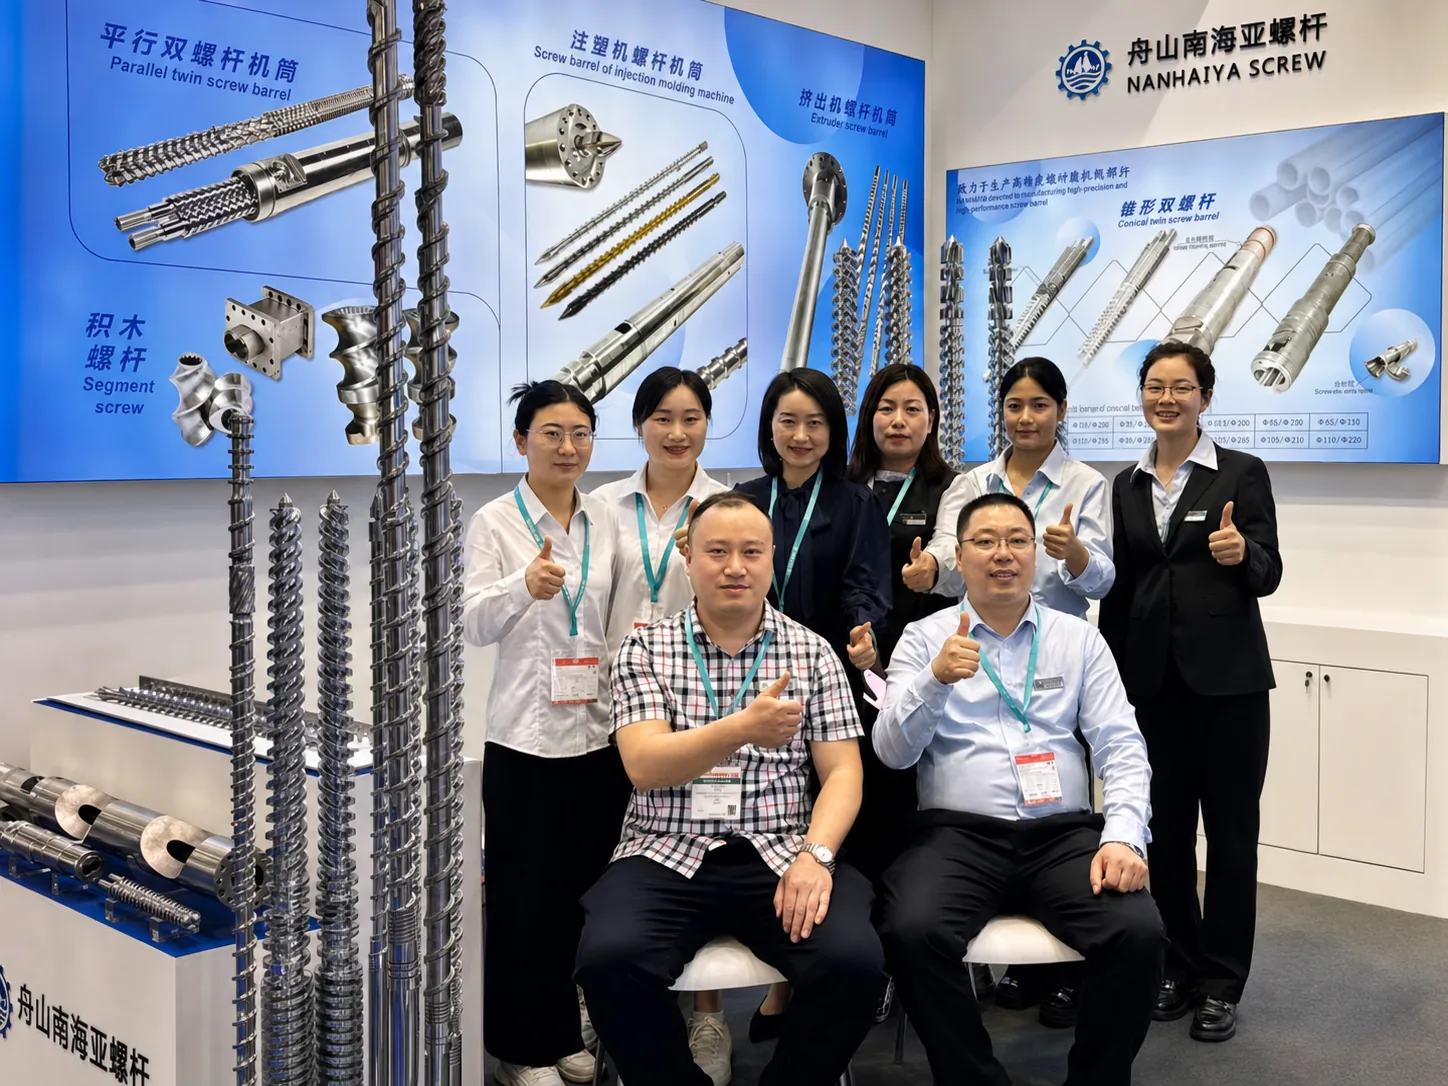
Related Articles
More insights on screw barrel technology and plastics processing.
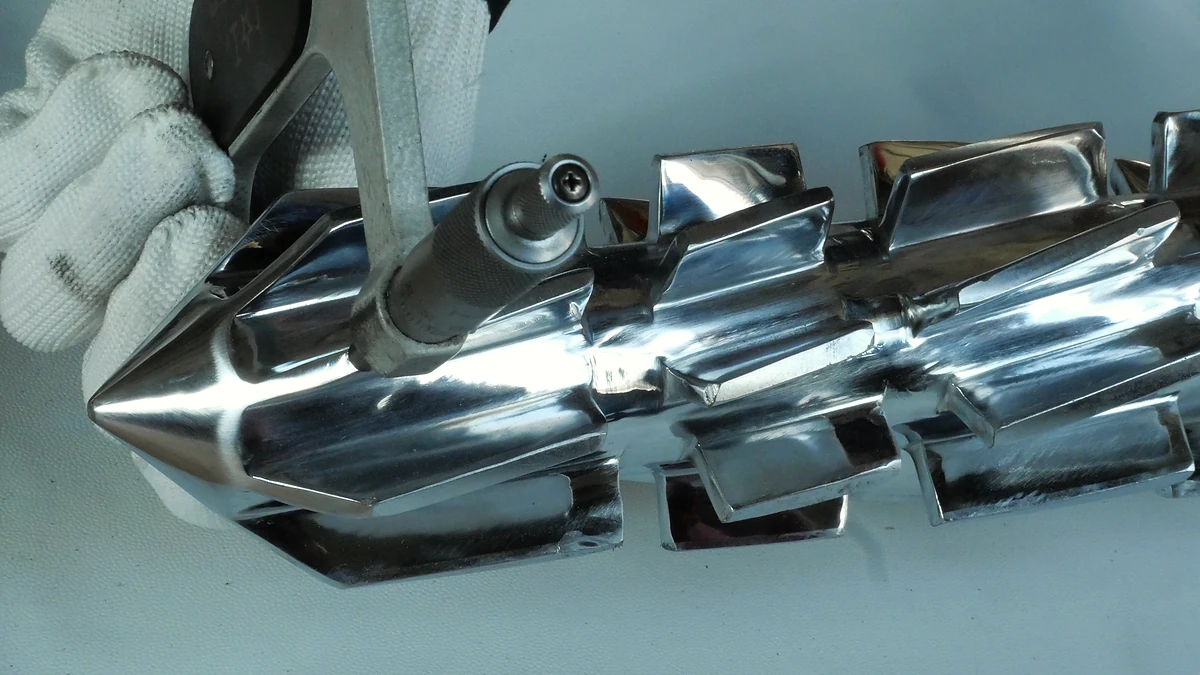
Purging Compound Decoded: Barrel Chemistry To Bottom-Line Savings
Nov 5, 2026
Learn how purging compounds clean barrels, screws, and hot runners. Compare chemical vs mechanical types, step-by-step procedures, selection tips, and cost savings.
Read Article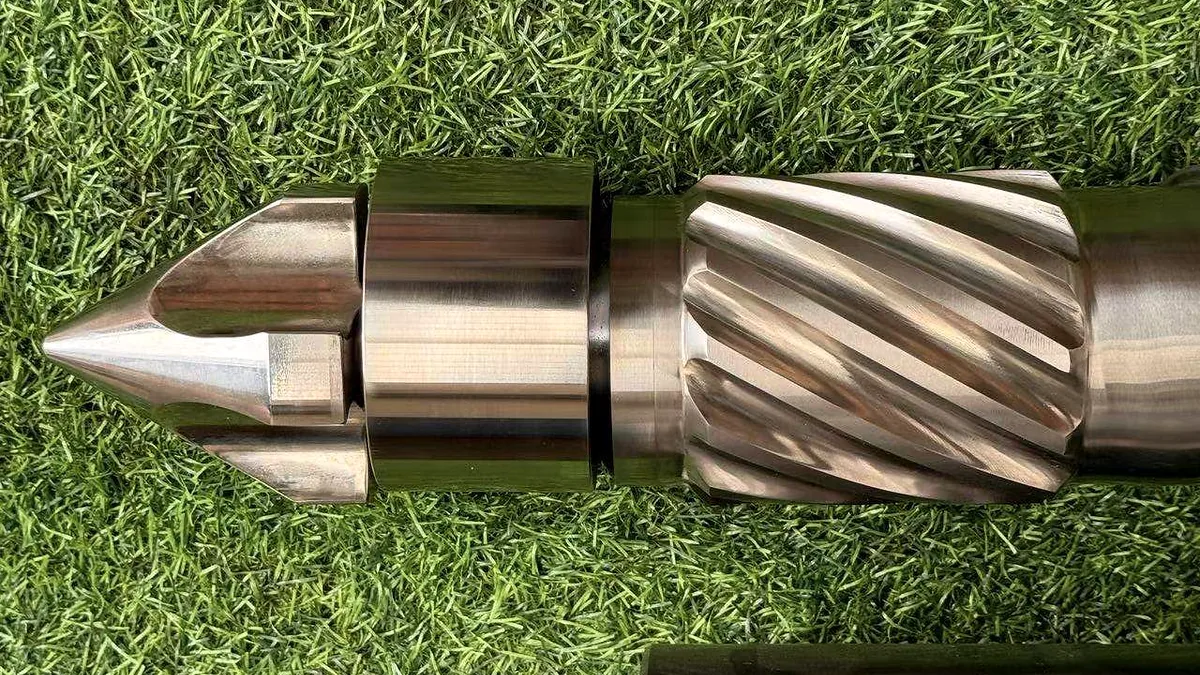
Stop Wasting Resin: How Mechanical Purging Compound Actually Works
Nov 5, 2026
Learn how mechanical purging compounds use shear force, high viscosity, and abrasive fillers to clean barrels. Covers dosage, procedures, resin matching, and maintenance tips.
Read Article
How Injection Molding Purging Compound Actually Cleans Your Barrel
Nov 5, 2026
Learn how injection molding purging compounds clean barrels, screws, and hot runners. Step-by-step procedures, compound types, common mistakes, and cost tips.
Read ArticleLooking for something else?
Search by material, symptom or product and jump straight to the relevant page.
These are navigation suggestions based on keyword matching — not a quotation, not a delivery commitment, and not a substitute for engineering review. Final specification is confirmed by our engineers against your drawings and processed material.
Need help with screw barrel selection?
Share your machine model, processed material and application. Our team can help with pricing and technical support.